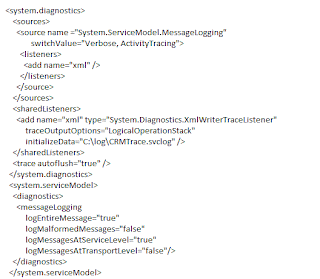
With CRM 4.0 I would use Fiddler to capture traffic to/from the client and server to see exactly what was happening. CRM 2011 Outlook client performance issues are not easy to tackle with Fiddler as The CRM 2011 Outlook client now uses WCF to request data from the CRM server. If you ever view the WCF traffic in fiddler or Netmon you will notice the request/response data is no longer in a readable format. In order to get details of the request/response you will need to use WCF tracing on the client machine. Below are the steps to enable and view the WCF tracing.
1. Create a folder directly on the c: drive called “log”. The name and location doesn’t matter as long as it matches the path provided in the config file.
2. Navigate to “C:\Program Files (x86)\Microsoft Dynamics CRM\Client\” and open the “client{guid}.config” file in a text editor such as notepad.
3. Insert the following block of XML in the

4. Save and close the CONFIG file.
5. Launch Outlook and you will see a trace file called CRMTrace.svclog will be created in the log folder you had created in step 1. All WCF traffic to the server will be logged while the client is running.
Viewing the WCF Traces
Once you have collected the trace it can be viewed using the SvcTraceViewer.exe utility which is only available in the .Net SDK. The SDK is an ISO file and can be downloaded at the following location.
http://www.microsoft.com/download/en/details.aspx?DisplayLang=en&id=11310
The SDK contains a lot of stuff, but if you just want the viewer you can select “Developer Tools \ .NET Development Tools” during the setup. The SvcTraceViewer.exe utility will then be located at C:\Program Files\Microsoft SDKs\Windows\v6.1\Bin
The SvcTraceViewer.exe can be found at the following location.
1. Launch the SvcTraceViewer.exe utility and choose file – Open. Select the trace file and choose Open.
2. Once the trace is opened you can click on the Message tab and choose specific messages to see the details. The details can be viewed in a formatted view or raw XML. In the following screenshots you will notice the WhoAmI request/Response, each showing up as a separate message.
Each request/response message pair will have a urn:UID that identifies them. This guid can be found in fiddler or netmon since it shows up as plain text in the WCF header. You can then match up the fiddler/netmon data to that in the WCF trace by searching on this guid as shown below. The combination of Fiddler and WCF tracing is very helpful with performance work. Using Fiddler you can identify large/long running requests and then use WCF tracing to get details of what the request is doing.
For more information about tracing and using the tool you can refer to the following MSDN article.
http://msdn.microsoft.com/en-us/library/ms732023.aspx
XCEL Technologies Ltd, Microsoft Partner


No comments:
Post a Comment